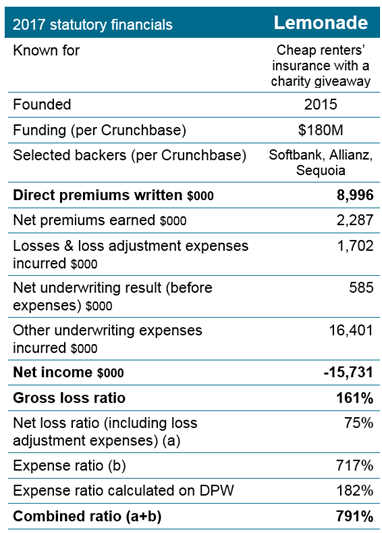
Nothing happens overnight in insurtech so let’s analyze the last 7 years and one quantitative prediction on Lemonade.
According to Venture Scanner the number of insurtech deals has been constantly on the rise in the past 7 years and the same goes for the number of investors that have placed their money in insurtech sector deals. Some of the expectations have been missed but the sector is evolving and this is great news for those who love the insurance industry.
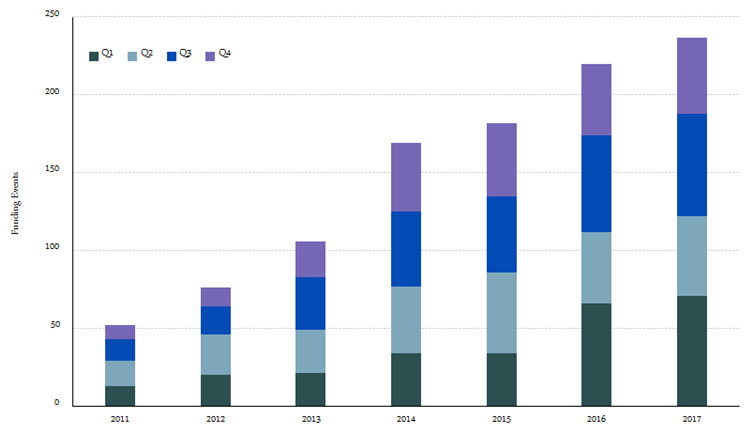
Funding Count by Quarter - Stacked
Source: Venture Scanner, data cumulative through December 2017.
The above graph illustrates how the number of insurtech funding events has seen an impressive growth. This is a sign that even though the amount invested year over year is declining, the insurtech sector remains a highly dynamic and interesting market to invest in.
The CAGR in funding events from 2012 to 2017 is 26%. In addition, the number of funding events in 2017 was 108% of that in 2016. We have seen that insurtech funding events are showing steady growth, but what about investor interest in the sector?
To gauge how investors are feeling, let’s look at the total number of insurtech investors who participated in each financing round.
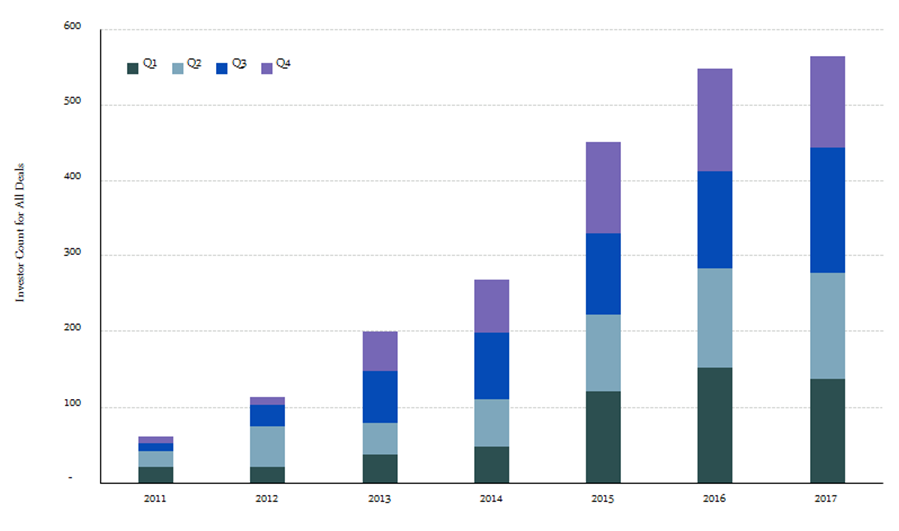
Total Number of Investors in All Deals
Source: Venture Scanner, data cumulative through December 2017.
The above graph shows that insurtech investor interest was on the rise for several years with a tendency towards leveling off in 2017. The CAGR for the number of participating investors between 2012-2017 is 39%.
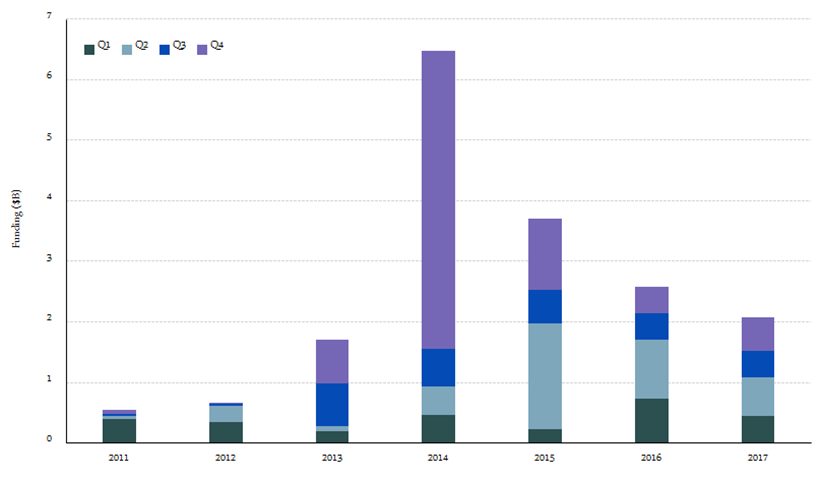
Let's now analyze the insurtech funding amounts over the years stacked by quarters. So despite the positive trends that we have seen above, yearly insurtech funding is on a downward path having reached its peak in 2014 with $6,86 B invested, while in 2017 the amount has dropped by almost 60% to $2,8 B.
Funding by Quarter - Stacked
Source: Venture Scanner, data cumulative through December 2017
It seems that insurtech funding amounts had a spectacular growth leading up to 2014 then declined steadily year by year. By analyzing the reason behind the 2014 peak and the less spectacular but still high funding amount in 2015, we come up with a simple answer: a few large funding rounds in the sector. For example in Q4 2014, the Chinese insurance company Ping An raised a $4.75 billion post-IPO equity round. In Q2 2015, companies such as ZhongAn, Zenefits, and Oscar Health collectively raised $1.58 billion. These large outlier funding events impacted the trend of annual insurtech funding amounts.
At the end of the last quarter of 2017, Lemonade also received $120 million of funding. Many of the most animated discussions in the past months have been about this full stack insurance player having already raised $180 million.
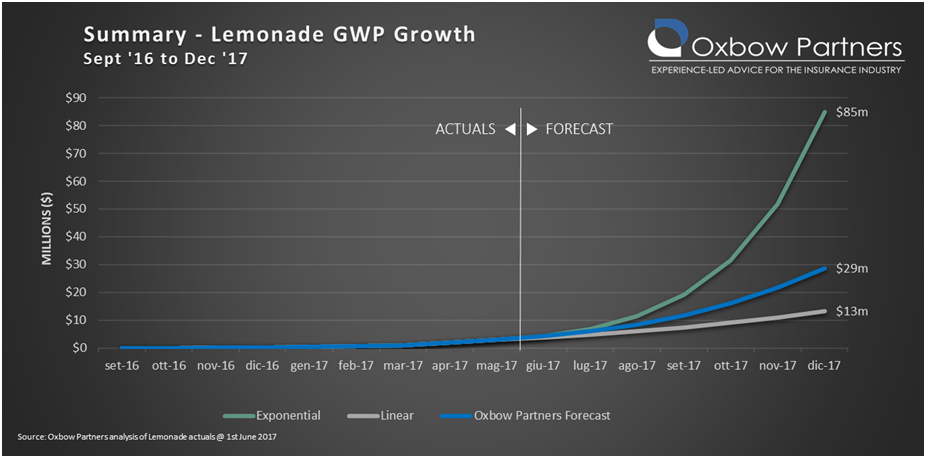
In June 2017 Oxbow Partners projected three scenarios with a range between $85 million and $13 million and was talking about a minimal loss ratio. That has boosted the discussion about the disruption potential of these new approaches.
Source: InsurTechNews, Oxbow Partners
The sad reality is that actual figures analyzed by Matteo Carbone and Adrian Jones show almost $9 million GWP and a gross loss ratio higher than 160%. According to the two authors, it is early to take conclusion but disruption is less and less used in the insurtech discussions.
Source: InsurtTechNews
Insurtech exit activity continues to be on a healthy upward trend.
Taking a look at insurtech exit events (includes acquisitions and IPOs) since 2011 onward, a general growth trend can be noticed with a peak registered in 2016. Specifically, the CAGR in exit activity from 2012 to 2017 is 46%.
Exits by Quarter - Stacked
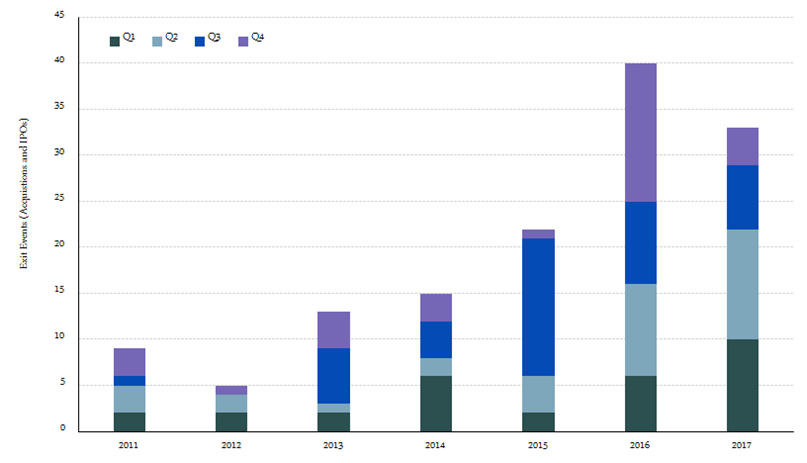
Source: Venture Scanner, data cumulative through December 2017
The graph below shows that insurtech exit activity is demonstrating overall growth at the quarterly level, with some outlier spikes and dips which are to be expected. The number of exit events in Q1 2017 was 120% of those in Q1 2016. Q2 2017 numbers were 167% higher than the year before. However, Q3 and Q4 of 2017 saw a decline compared to 2016 figures.
Exits by Quarter - Cluster
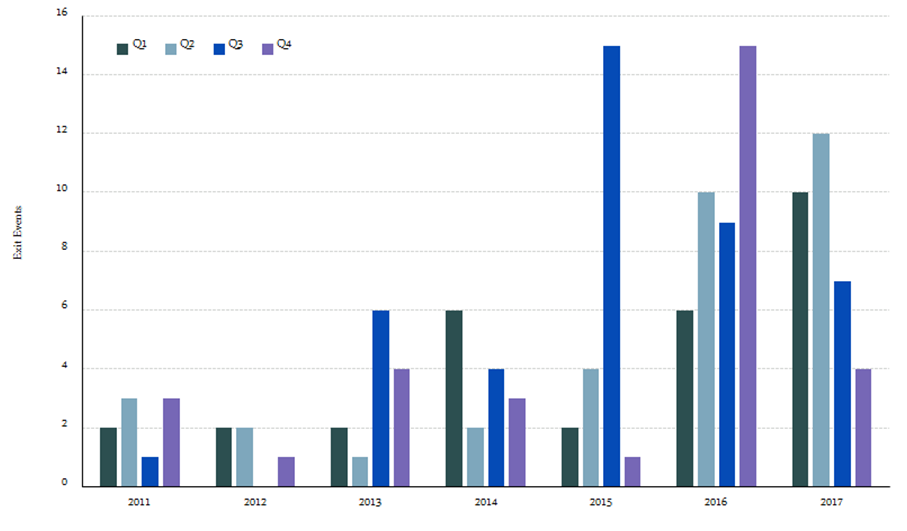
Source: Venture Scanner, data cumulative through December 2017
We can conclude from these takeaways that insurtech companies are getting acquired and going public at an increasing pace over time based on the number of Exits. Another important point is that the amount invested year over year in insurance technology is declining, but it still remains a highly attractive and dynamic market for investors.


